Edit colors
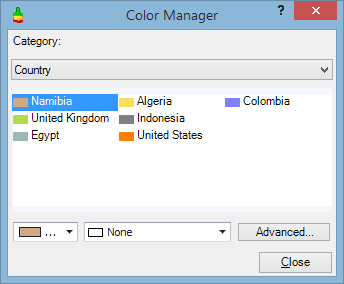
The Color Manager is used to edit the color styles of charts. To open it, right-click in the chart background or right-click over a particular project, and select the Colors and Markers option from the context menu. If you right-click in the background, the Color Manager will contain options for all objects on the chart; if you right-click on a particular item, you will see options only for that item. Below you will find instructions on how to edit colors for several items; the process for editing a single item is simpler.
- Select the type of item you want to edit in the Category list. The box below it will be filled with names of items of this type.
- Open the drop-down list with the colored bar to select a new color. You have a choice of custom or standard web colors.
- Open the drop-down list with the symbol (by default it shows None) to select the shape of data points.
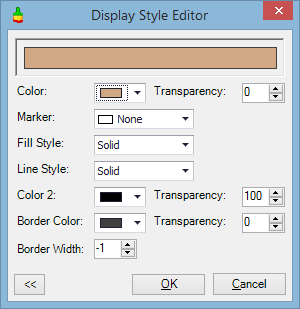
- For more options, click Advanced and the window shown below will be displayed. All fields are
explained in the table below. Click the arrow
to display fewer options, or click
to display more options.


| Field | Description |
|---|---|

|
Shows the appearance of the item with the current style and color settings. |
| Color | Click the arrow to select a color. Choose from custom, standard web or system colors. |
| Transparency | Transparency is used to make the data grid on the chart visible. Specify a value between 0 and 100 (0 is opaque, 100 is fully transparent). |
| Marker | Select the shape of data points on the chart. |
| Fill Style | Select the style: None (no fill), Solid (single-color fill), Gradient (fading color), or Hatch (checked background). |
| Line Style | Select the style of the shape outline from the list. You have a choice of solid and dashed styles. |
| Color 2 | Define the second color to be used when the fill style is set to Gradient or Hatch. |
| Border Color | Select the border color. Choose from custom, standard web or system colors. |
| Border Width | Select the border width in pixels. Value 0 means no border. Value -1 means the border will be defined automatically depending on the chart type. |